New Media Unlocked!
You can now publish on USA TODAY through MarketersMEDIA. That's 142M+ monthly visitors and DR 92 backlinks for every release you publish.
Better reach, better SEO, better credibility.
You can now publish on USA TODAY through MarketersMEDIA. That's 142M+ monthly visitors and DR 92 backlinks for every release you publish.
Better reach, better SEO, better credibility.
Table of Content


Most marketing teams have no shortage of data.
Impressions, click-through rates, views, follower counts, branded search volume, these numbers are easy to pull and easy to report.

The problem is that none of these numbers show how your brand is performing relative to everyone else in your market.
Your brand could be growing month over month.
Traffic may be increasing and campaigns might be performing better than they did last quarter.
But if another company is becoming more visible across your industry, that growth may not mean much.
While you are improving your own performance, competitors may be appearing more often in search results, industry coverage, and online discussions.
Over time, that visibility shapes which brands people recognize when they start looking for a solution.
Without a competitive frame, your performance data is just a score without a scoreboard.
Share of voice provides that scoreboard.
It measures how much of the total visibility and coverage in your industry belongs to your brand compared with your competitors.
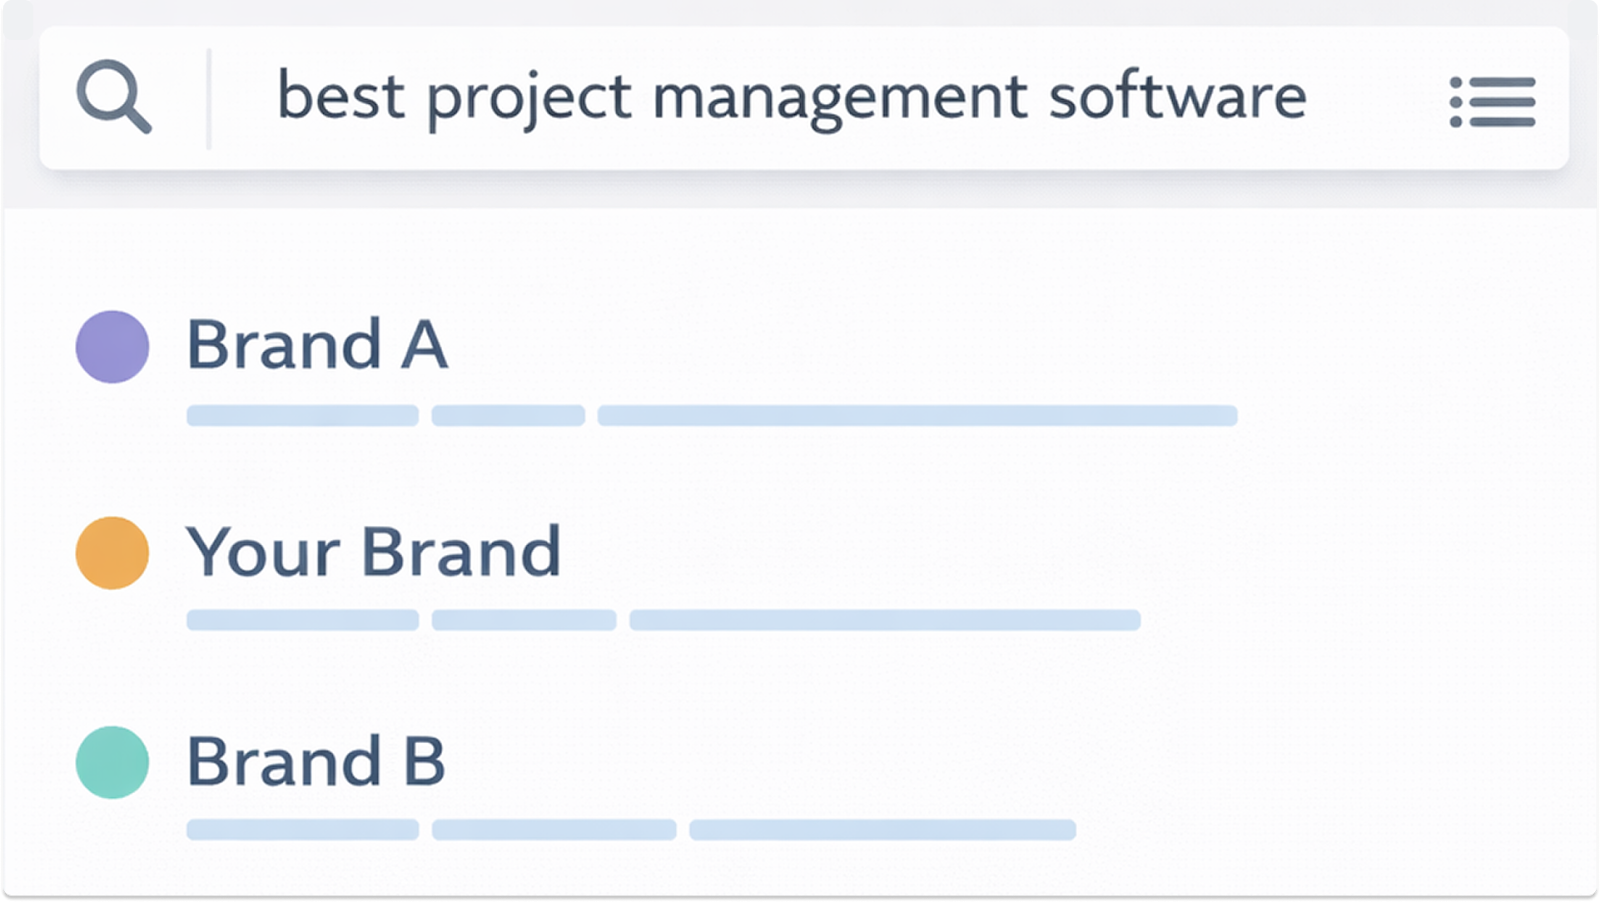
Share of voice (SOV) is a metric that measures how visible your brand is in your market compared with your competitors.
Example of share of voice pie chart showing your brand visibility compared to competitors:
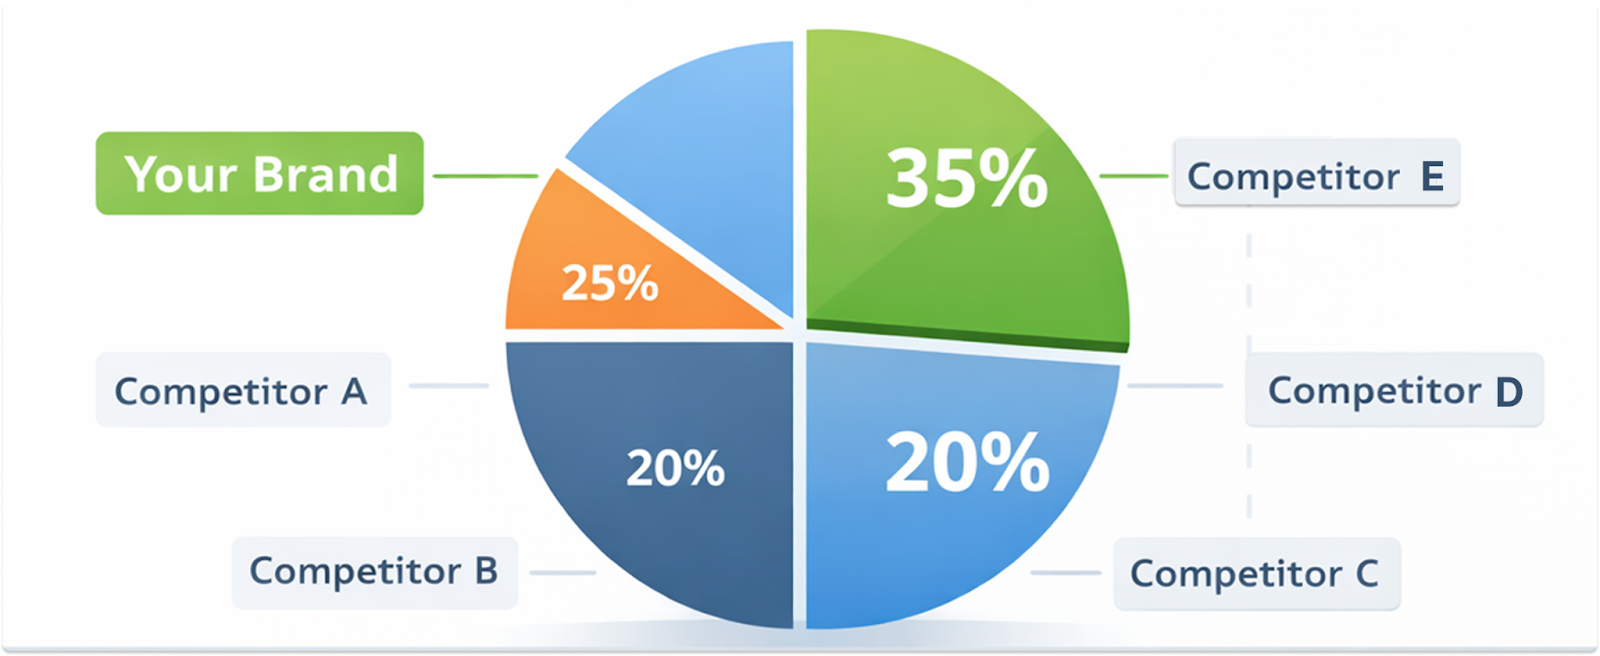
In simple terms, it shows what percentage of the total attention in a market belongs to your brand.
The concept originally came from paid advertising, where it was used to compare advertising spend between competing brands.
Companies that spent more typically appeared in more ad placements, so spend became a rough indicator of visibility.
That logic still applies in paid media today.
What’s changed is the scope. SOV now applies across every channel where brands compete for audience attention:
| Channel | What Share of Voice Measures | Example Metrics |
| Organic Search | How much of the relevant keyword landscape your content ranks for compared to competitors | Keyword rankings, organic traffic share, SERP visibility |
| Social Media | How large a share of the branded conversation in your category your brand generates | Mentions, hashtags, engagement, share of discussion |
| Earned Media | How often your brand appears in news articles and industry publications compared to competitors | Media mentions, press coverage, backlinks |
| Paid Advertising | What percentage of eligible ad impressions your brand actually wins | Impression share, ad visibility, ad placements |
Each channel tells you something different about your brand’s visibility. Tracking just one gives you a partial view. But, looking at all four gives you a complete competitive picture.
These two metrics are often mentioned together, but they measure different things.
Share of market measures how much of your industry’s total sales or revenue your brand captures.
For example, if your industry generates $20 million in annual revenue and your brand accounts for $4 million, your market share is 20%.
This number reflects what has already happened:
In other words, share looks at the past.
Share of voice, on the other hand, measures something happening right now.
It shows how visible your brand is compared with competitors across the channels your buyers use, such as search, social media, and press coverage.
It does not measure sales. It measures how often people see or hear about your brand.
The relationship between these metrics is often explained using a concept called Excess Share of Voice (ESOV).
ESOV = Share of Voice − Share of Market
If your share of voice is higher than your market share, your brand is getting more attention than its current size suggests.
Over time, that visibility often leads to growth because more people become familiar with your brand.
If your share of voice is lower than your market share, it can be a warning sign.
Your brand may not be generating enough visibility to maintain its current position, while competitors are gaining attention.
Most buyers start forming opinions before they make a purchase.
They notice the brands they repeatedly see in search results, industry articles, and online discussions.
Share of voice measures how often your brand appears in those moments.
The more consistently your brand shows up, the more likely buyers are to recognize and consider it when they are ready to choose a solution.
The formula is consistent across every channel:
Share of voice = (Your brand metric ÷ Total market metric) × 100
Your brand metric is whatever you’re measuring, including:
The total market metric is that same number added up across your brand and every competitor you’re tracking. The result is a percentage showing your brand’s slice of the total.
Before you run any calculation, two decisions need to be made clearly: who goes in your competitive set, and which metric you use.
Both of these determine what your share of voice number actually represents.
But, if either one is off, the calculation may still produce a clean percentage, but it won’t reflect the real competitive situation.
Below are two steps to calculate your share of voice.
Include brands that compete for the same audience attention in the specific channel you’re measuring.
Your SEO competitors are the brands ranking for the same keyword clusters. For example:
Your social competitors are the brands appearing in the same conversations your buyers have.
These two lists are often different, so use the appropriate competitive set for each channel.
Pick one variable and apply it consistently to every brand in the calculation.
This could be mentions, impressions, keyword rankings, or article count. What matters is that every brand is measured using the same metric.
Mixing mention counts for some brands and impression figures for others makes the comparison invalid.
Here are worked examples across all four main channels:
Your brand received 2,000 mentions last month. Your three tracked competitors received 3,500, 2,800, and 1,700 mentions respectively.
Total mentions across all brands: 2,000 + 3,500 + 2,800 + 1,700 = 10,000 Your social SOV: (2,000 ÷ 10,000) × 100 = 20%
You hold 20% of the total category conversation.
The brand with 3,500 mentions holds 35% — that’s the primary gap. The follow-up question is whether those mentions are positive, neutral, or negative, because volume without sentiment context can be misleading.
Your brand’s target keywords collectively generate 15,000 monthly impressions in Google search results. The same keyword set, tracked across all competitors, produces a total pool of 100,000 impressions.
Your SEO SOV: (15,000 ÷ 100,000) × 100 = 15%
Eighty-five percent of the available search attention in your category is going to other brands. That baseline tells you how large the opportunity is.
The next question is which specific keywords account for the biggest gaps, and whether those terms are ones you can realistically compete for with existing content or new pages.
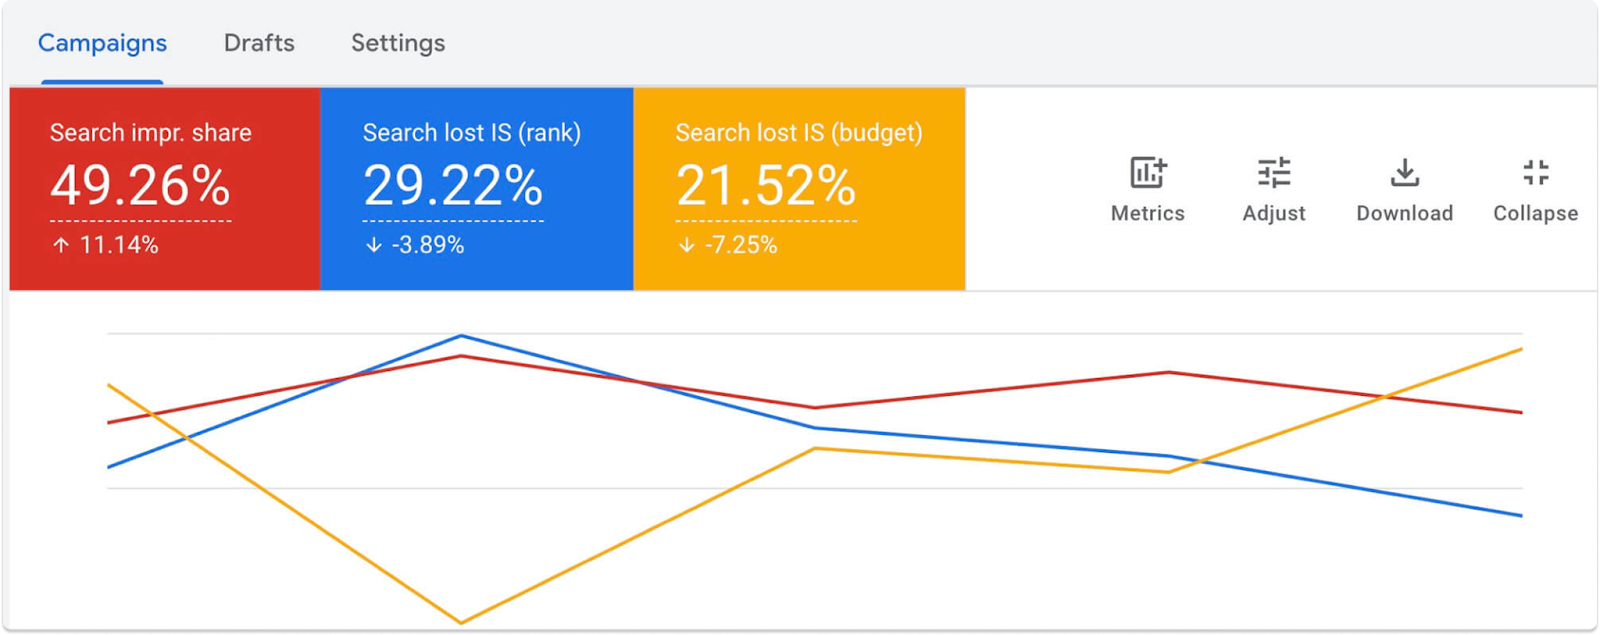
Your ads were eligible to appear 1,000,000 times across your campaign period but only showed 200,000 times due to budget exhaustion and bid constraints.
Your PPC SOV (Impression Share): (200,000 ÷ 1,000,000) × 100 = 20%
Google Ads also reports how much of the lost 80% was due to budget versus rank. If most losses are budget-related, your ads are competitive but underfunded.
Increasing spend toward top-performing keywords recovers impression share directly.
If most losses are rank-related, improving ad relevance, landing page quality, or bid strategy will have more impact than spending more.
Your brand was mentioned in 45 articles last month. Your two main competitors received 80 and 55 mentions respectively.
Total mentions: 45 + 80 + 55 = 180: Your earned media SOV: (45 ÷ 180) × 100 = 25%
This is where mention count alone gets deceptive.
Two brands both at 45 mentions can have very different earned media SOV in terms of real-world impact if one earned a feature in a major national publication and the other collected 45 brief references in low-traffic blogs.
Pairing mention count with estimated reach or outlet authority gives you a more accurate read.
The metric you use should reflect how much audience attention your brand captures in a specific channel. Each channel measures attention differently.
In search, share of voice measures how much search visibility your brand captures compared to competitors.
The most common SEO SOV metrics are:
Keyword visibility looks at how many relevant keywords your brand ranks for and at what positions compared to competitors.
A brand ranking in the top three positions for high-intent commercial keywords holds far more search visibility than one ranking on page two.
Impressions show how many times your pages appear in search results for relevant queries.
This data comes directly from Google Search Console and represents a clean measure of raw search presence.
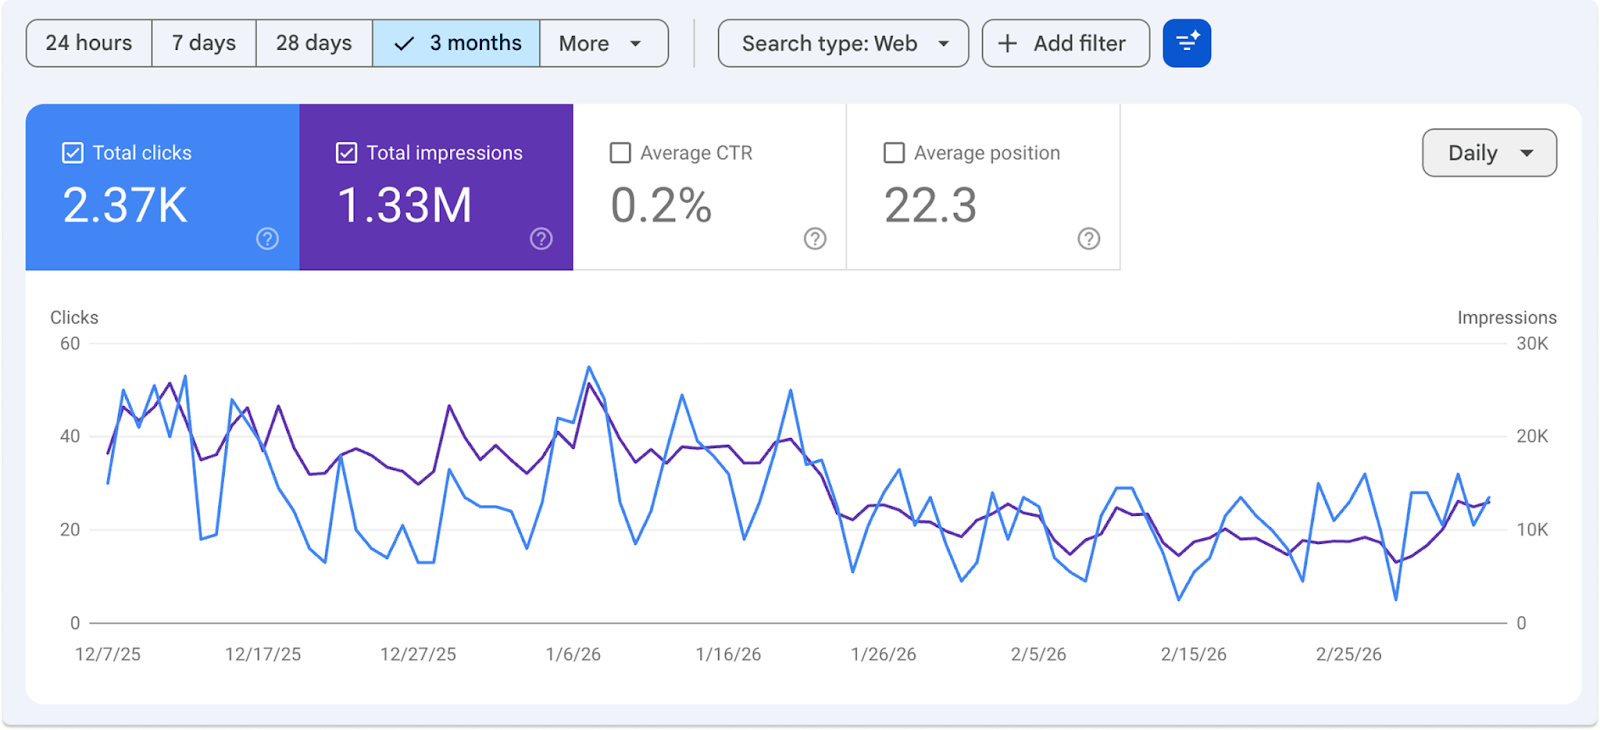
Clicks measure how much of that search visibility turns into actual traffic.
A page may generate many impressions but few clicks if:
In paid search and display advertising, share of voice is measured using Impression Share.
Impression Share shows the percentage of eligible ad impressions your brand actually received.
Google Ads breaks this into three components:
The percentage of eligible impressions your ads won.
Impressions you lost because your bid or ad quality was not competitive enough.
Impressions you lost because your daily budget ran out.
These three values add up to 100% and reveal why your ads are missing visibility.
If most losses come from budget, increasing spend can recover visibility. If losses come from rank, improving ad quality or landing page relevance is the better solution.
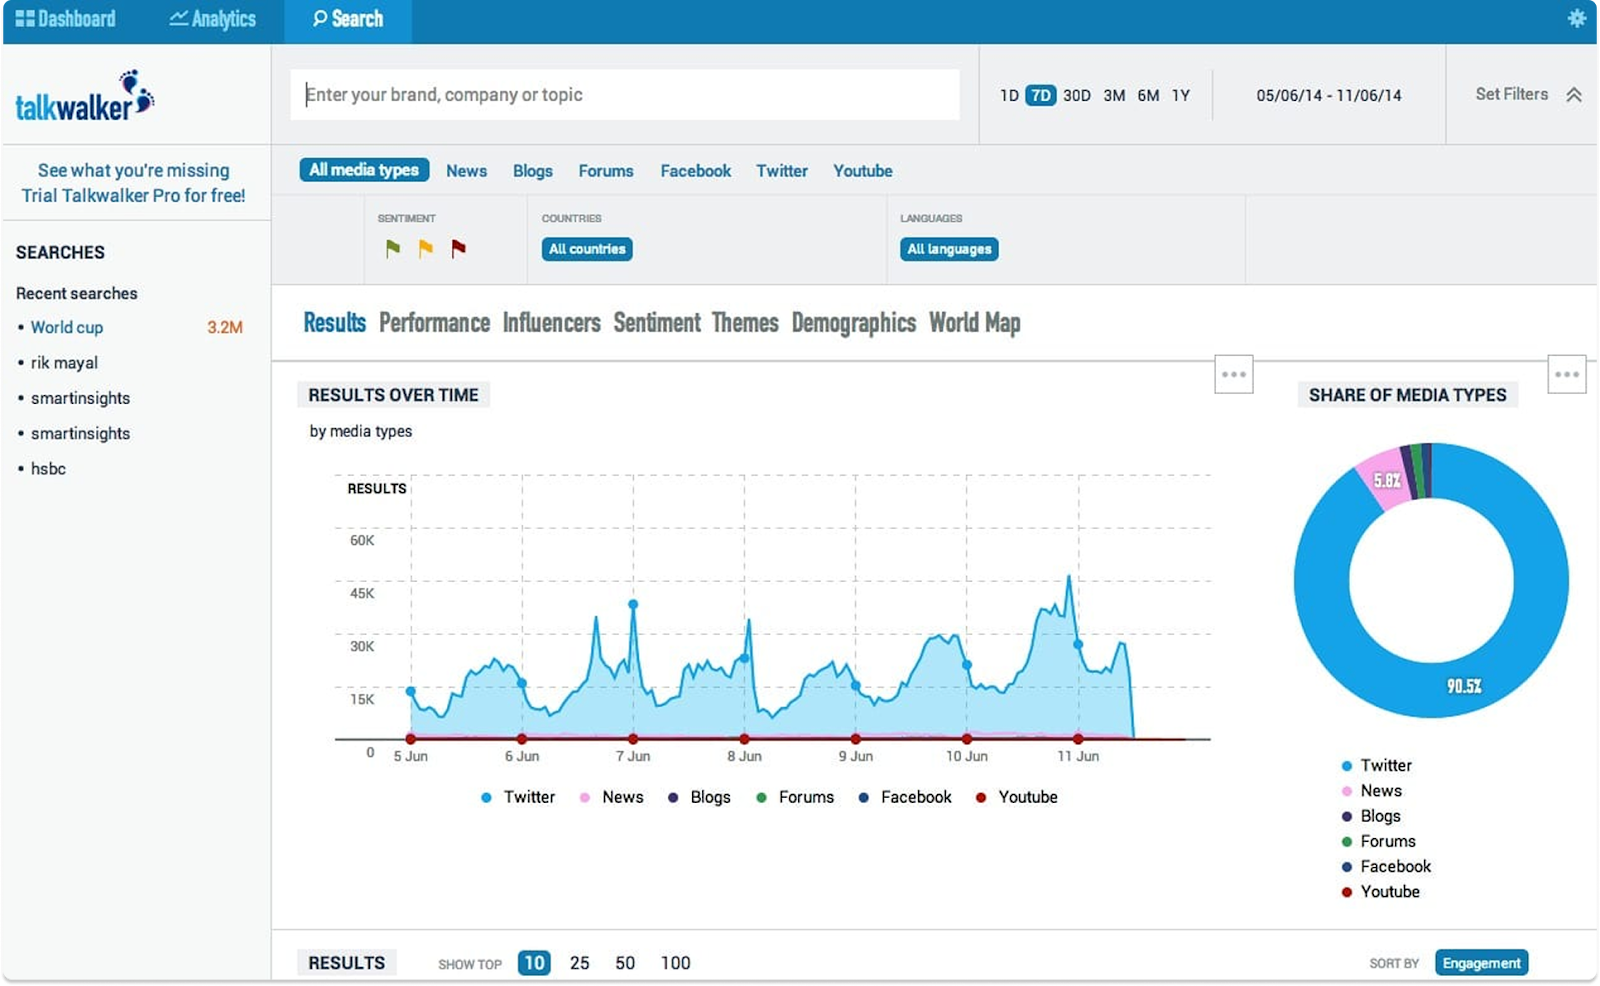
Social share of voice measures how much of the total conversation in your category mentions your brand compared to competitors.
This is calculated by tracking how often your brand appears across social platforms.
Typical inputs include:
Engagement share measures your brand’s likes, comments, shares, and saves as a percentage of all engagement in the category.
Earned media share of voice measures how often your brand appears in press coverage compared to competitors.
This includes coverage in:
The three most useful metrics are:
The number of times your brand appears in media coverage.
This is the simplest volume metric.
Share of reach estimates how large the audience was for coverage mentioning your brand.
For example, one article in a publication with 2 million readers may carry more impact than twenty mentions in small outlets.
Prominence measures how central your brand is to the article.
Your brand may appear as:
A smaller number of high-authority, high-prominence placements often delivers more value than many small mentions.
SOV can be calculated manually, but most teams rely on software for ongoing tracking.
Designed for large marketing teams tracking high volumes of social conversation.
Key features include:

Widely used for media monitoring and PR analysis.
It also detects brand logos in images, capturing mentions that text monitoring misses.
When choosing a social listening tool, look for:
SEO SOV requires a different type of tool: one that tracks keyword rankings and search visibility across your brand and competitors simultaneously.
This is the most commonly used tool for this purpose.
Its Market Explorer report estimates traffic share by domain within a defined category, giving you a proxy for SEO SOV without manually aggregating keyword-level data.
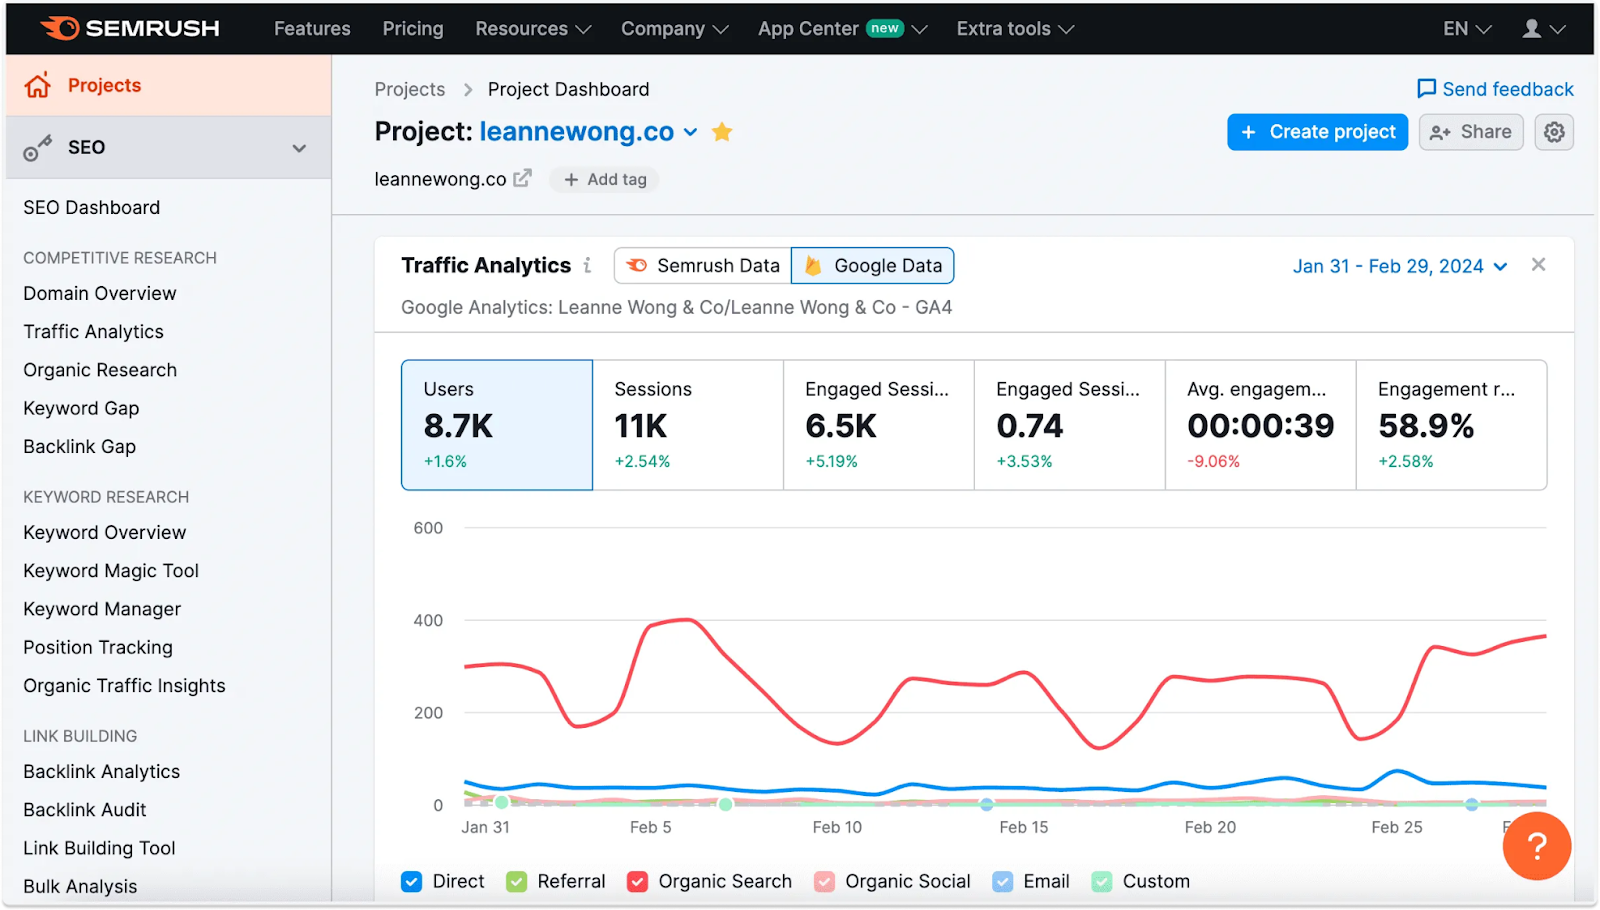
The Keyword Gap tool surfaces which terms competitors rank for that your brand doesn’t yet target — a direct input for content planning.
It is similarly capable.
Its Content Gap feature does the same thing as SEMrush’s Keyword Gap: enter your domain alongside competitors, and it surfaces keywords driving traffic to them that you’re not capturing.
For brands building a content-led SEO strategy, this output is one of the most practically useful things SOV analysis produces.
One important note: SEO SOV figures from these tools are estimates, not exact measurements. They work from their own keyword databases, which don’t capture every query. Use them for directional comparisons and trend tracking rather than treating the numbers as precise absolutes.
This is the primary source of truth for PPC SOV.
The Auction Insights report shows your Impression Share alongside the Impression Share of competing brands appearing in the same auctions.
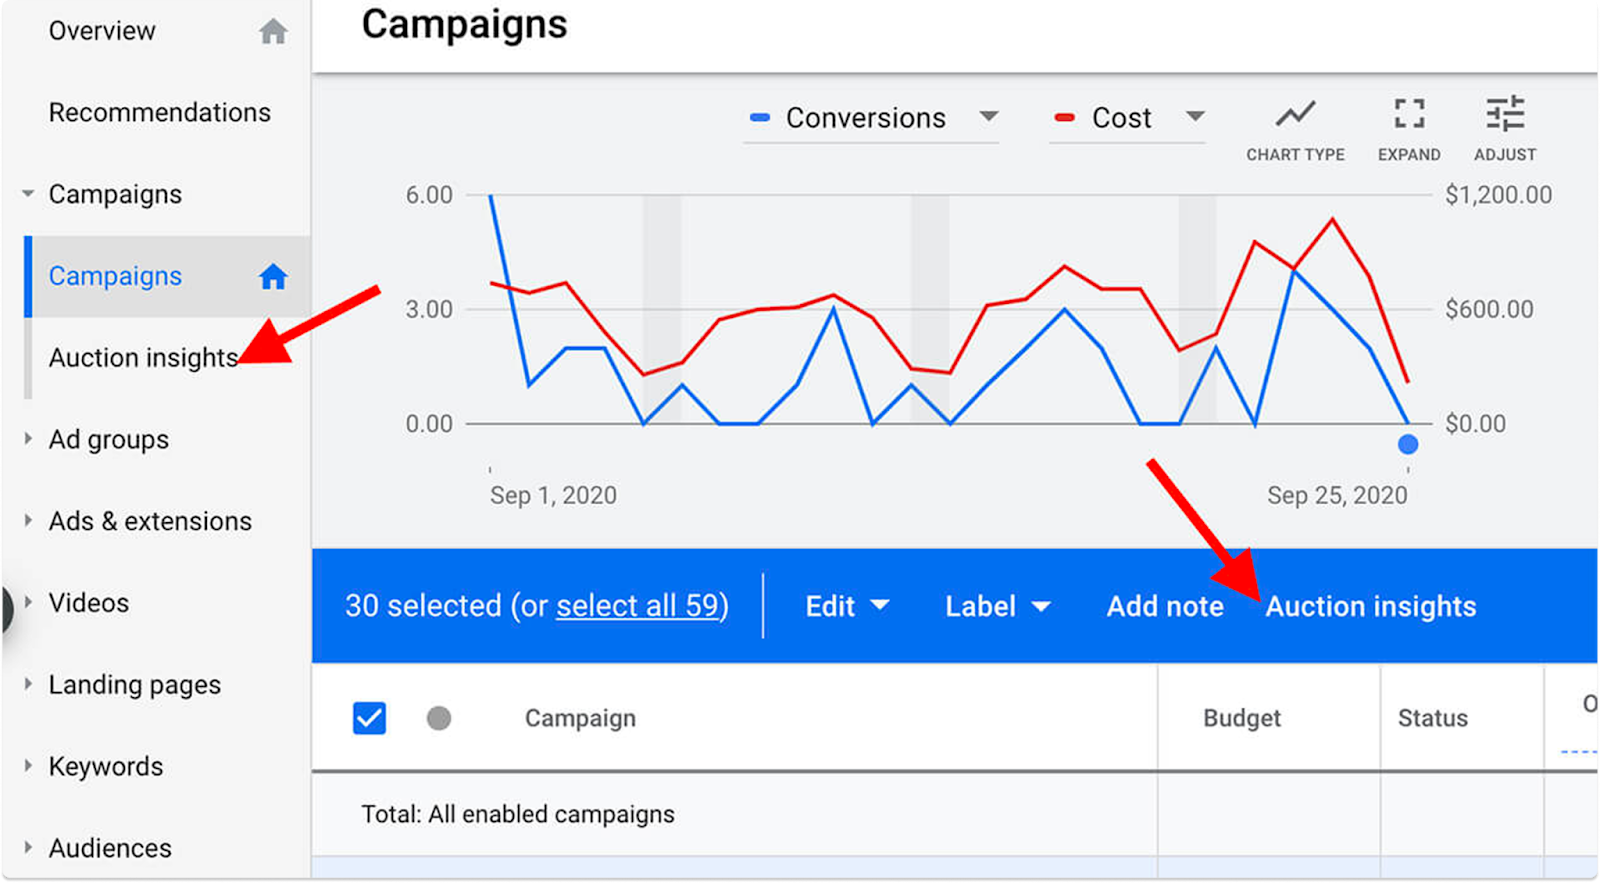
This is channel-native data and it is more accurate than any third-party estimate for paid search.
The Auction Insights report also includes top-of-page rate and outranking share, which give you a richer view of competitive position.
A brand that wins fewer impressions but consistently appears above the fold will drive more attention than one with a higher raw Impression Share but poor average placement.
It doesn’t offer an equivalent Impression Share metric.
Estimating paid SOV on Meta platforms requires combining your reach data with estimates of total category audience size which typically needs a third-party tool or manual benchmarking against reported competitor reach figures.
This tool goes further by attributing media coverage to website traffic and downstream outcomes, which is useful if you want to connect earned media SOV to actual buyer behaviour rather than stopping at coverage volume.
For teams that primarily need to surface new press coverage without a full PR platform, Google Alerts is a free starting point.
It won’t produce a structured SOV calculation, but it flags new mentions as they appear — useful as a lightweight early warning system between full monthly reports.
Share of voice is one of the clearest indicators of where a brand is headed.
It does not measure the outcome of a single campaign. It measures how visible your brand is across the channels that influence buyer decisions.
Brands that monitor SOV regularly gain an advantage. They detect competitive movements earlier, identify which channels build lasting visibility, and see where their presence is falling behind competitors before those gaps affect revenue.
One channel that consistently supports long-term share of voice growth is earned media.
Coverage in credible outlets builds familiarity and trust in ways paid advertising cannot fully replicate. It provides third-party validation and reaches audiences who often ignore traditional ads.
If earned media is still underdeveloped in your visibility strategy, MarketersMEDIA Newswire helps brands secure consistent exposure across 2,000+ media endpoints, including outlets such as Business Insider, AP News, and Yahoo Finance.
Explore our distribution plans to see how press release distribution can support long-term share of voice growth. Get in touch with us today!
Free Press Release Template
Get your free copy of press release template and advanced PR guide to run your press release.

A: There’s no single benchmark that applies across industries. In a tightly defined niche, 20% might represent category leadership. In a broad consumer market with dozens of competitors, 5% could be a strong position. The most useful comparison is internal: track your SOV against your own market share over time. A consistently higher SOV than market share puts your brand in a growth position. A consistent shortfall is a signal that visibility investment needs to increase.
A: Brand awareness measures whether people recognise or recall your brand when asked. Share of voice measures how much of the active industry conversation your brand generates relative to competitors. The relationship between the two is causal — higher share of voice builds stronger brand awareness over time because your brand shows up more consistently in the moments when buyers are forming their consideration sets.
A: Yes. Google Alerts captures brand mentions across the web. Google Trends shows relative search interest between brands over time. Native analytics on LinkedIn, Instagram, and X provide basic reach and mention data at no cost. The limitation is speed and scale — manual tracking is harder to maintain consistently across multiple channels as your monitoring needs grow. Dedicated tools become worth the investment when you need cross-channel data in a standardised, comparable format.
A: Monthly is the standard cadence for ongoing strategy reviews. Weekly monitoring is useful during active campaigns, product launches, or periods of rapid competitive movement — it gives you a faster read on whether what you’re doing is actually shifting your position. The non-negotiable rule is consistency: irregular measurement intervals produce data that can’t be compared reliably over time.
A: Share of search focuses specifically on branded search volume — how often people search for your brand name compared to competitors. It’s a useful leading indicator of brand strength on its own. Share of voice is the broader framework that covers all channels where brand visibility can be tracked and compared, of which branded search is one component. The two often move together, but SOV gives you a more complete view of competitive position across the full buyer journey.


 PR playbook to get your brand cited in AI answer
How to check and fix what AI says about your brand
2 minutes checklist to make your PR AI-friendly
PR playbook to get your brand cited in AI answer
How to check and fix what AI says about your brand
2 minutes checklist to make your PR AI-friendly