New Media Unlocked!
You can now publish on USA TODAY through MarketersMEDIA. That's 142M+ monthly visitors and DR 92 backlinks for every release you publish.
Better reach, better SEO, better credibility.
You can now publish on USA TODAY through MarketersMEDIA. That's 142M+ monthly visitors and DR 92 backlinks for every release you publish.
Better reach, better SEO, better credibility.
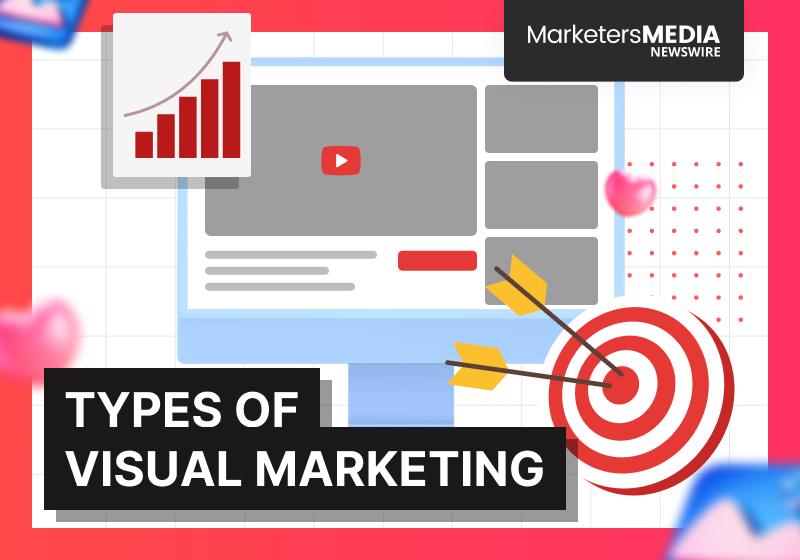
Table of Content


People process visuals 60,000 times faster than text. That single fact shapes nearly every decision marketers make about content today.
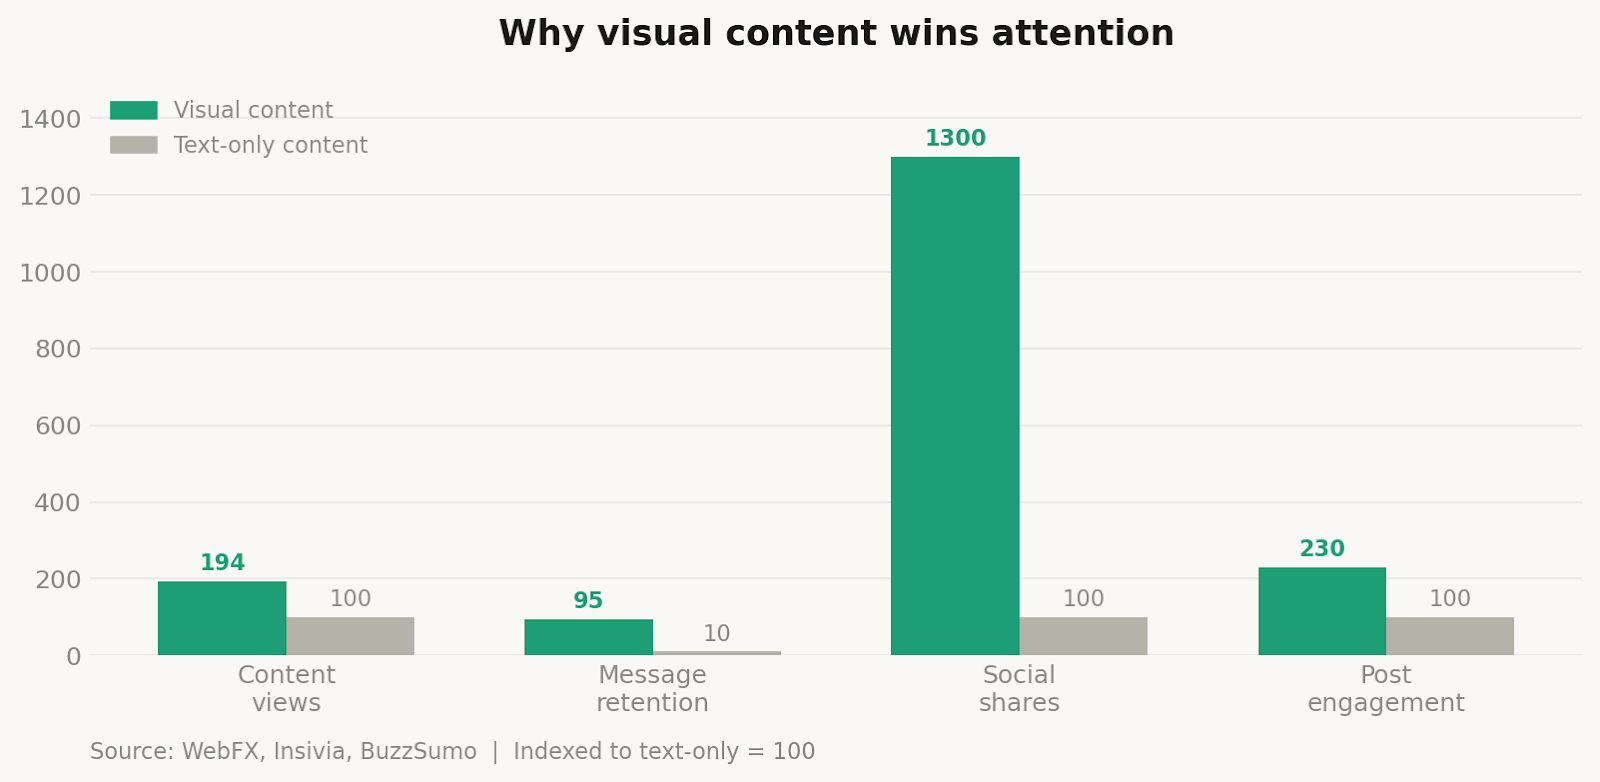
Visual content gets 94% more views than text-only content, and viewers retain 95% of a message delivered through video compared to just 10% when reading the same information in text. The math is hard to argue with. Attention is scarce, and visuals earn more of it than words alone.
The challenge for most marketers is not accepting that visual content works. It is knowing which formats to use, when to use them, and what each type is actually built to do.
Below is a breakdown of the major types of visual marketing, what distinguishes each one, and where each format performs best:
Images are the most fundamental unit of visual marketing. High-quality photography builds brand credibility quickly. It communicates mood, product quality, and brand identity before a single word is read.
There are three practical categories most brands work with:
It is the strongest trust signal.
Product shots, team photos, behind-the-scenes content, and event images all communicate something that stock photos cannot: this brand exists and operates in the real world.
It fills gaps efficiently when custom production is not viable.
The risk is visual sameness. Audiences scroll past generic stock photos with the same speed they dismiss ads.
If stock is used, it should be chosen carefully to match brand tone.
This method has become one of the most effective image categories.
48% of consumers say photos from other customers are more trustworthy than brand photography. UGC reduces production cost while increasing credibility.
Images are the baseline. Every brand needs them. The question is whether the images in use are building a visual identity or just filling space.
Real customer photos paired with reviews and ratings are considered as UGC:
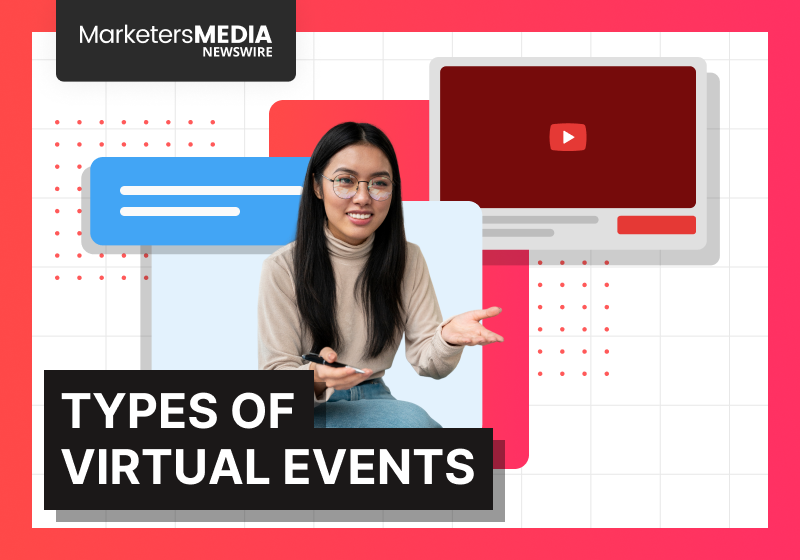
91% of businesses use video as a marketing tool in 2026, and 93% consider it an important part of their strategy.
That adoption rate reflects what video actually does that other formats cannot: it holds attention across multiple senses simultaneously.
The main video formats used in marketing each serve a different function:
These videos are designed to simplify a product or service.
96% of people say they watch explainer videos to learn about a product before making a purchase.
Short, clear, and focused on a single idea, these are particularly effective for SaaS, financial services, or any offering that requires explanation before conversion.
These videos use driving platforms like TikTok, Instagram Reels, and YouTube Shorts. They are built for the scroll. Videos under 60 seconds see average engagement rates around 50%. They are designed for speed:
These videos build authority. Tutorials, deep-dives, webinar recordings, and documentary-style content work best when an audience already has a reason to spend time. Adults in the UK watched YouTube for an average of 51 minutes per day in 2025, which signals the sustained appetite for long-form when the content is genuinely useful.
They operate differently from any other format. It creates unedited, real-time interaction. The production quality is lower; the authenticity is higher. Live video receives 6x more engagement than pre-recorded video, and people spend 3x longer watching live than they do watching standard video content.
This type of videos transfers trust from customers to prospects. They differ from UGC in that they are produced with intention. A customer speaking directly to camera about a specific result carries weight that a product page cannot replicate.
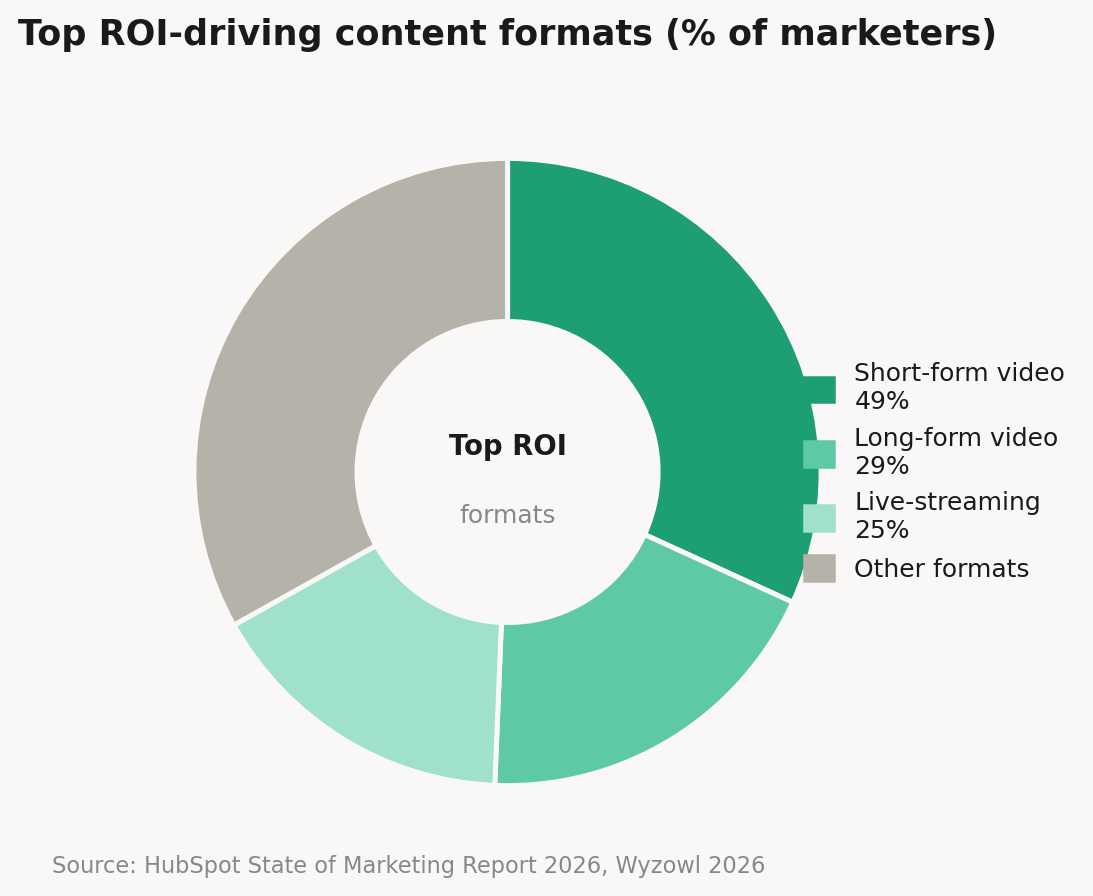
The top three ROI-driving content formats are all video-based: short-form video at 49%, long-form video at 29%, and live-streaming at 25%.
Infographics translate information into visual structure.
They are particularly effective when data needs to be made accessible, when a process has multiple steps, or when a comparison needs to be clear at a glance.
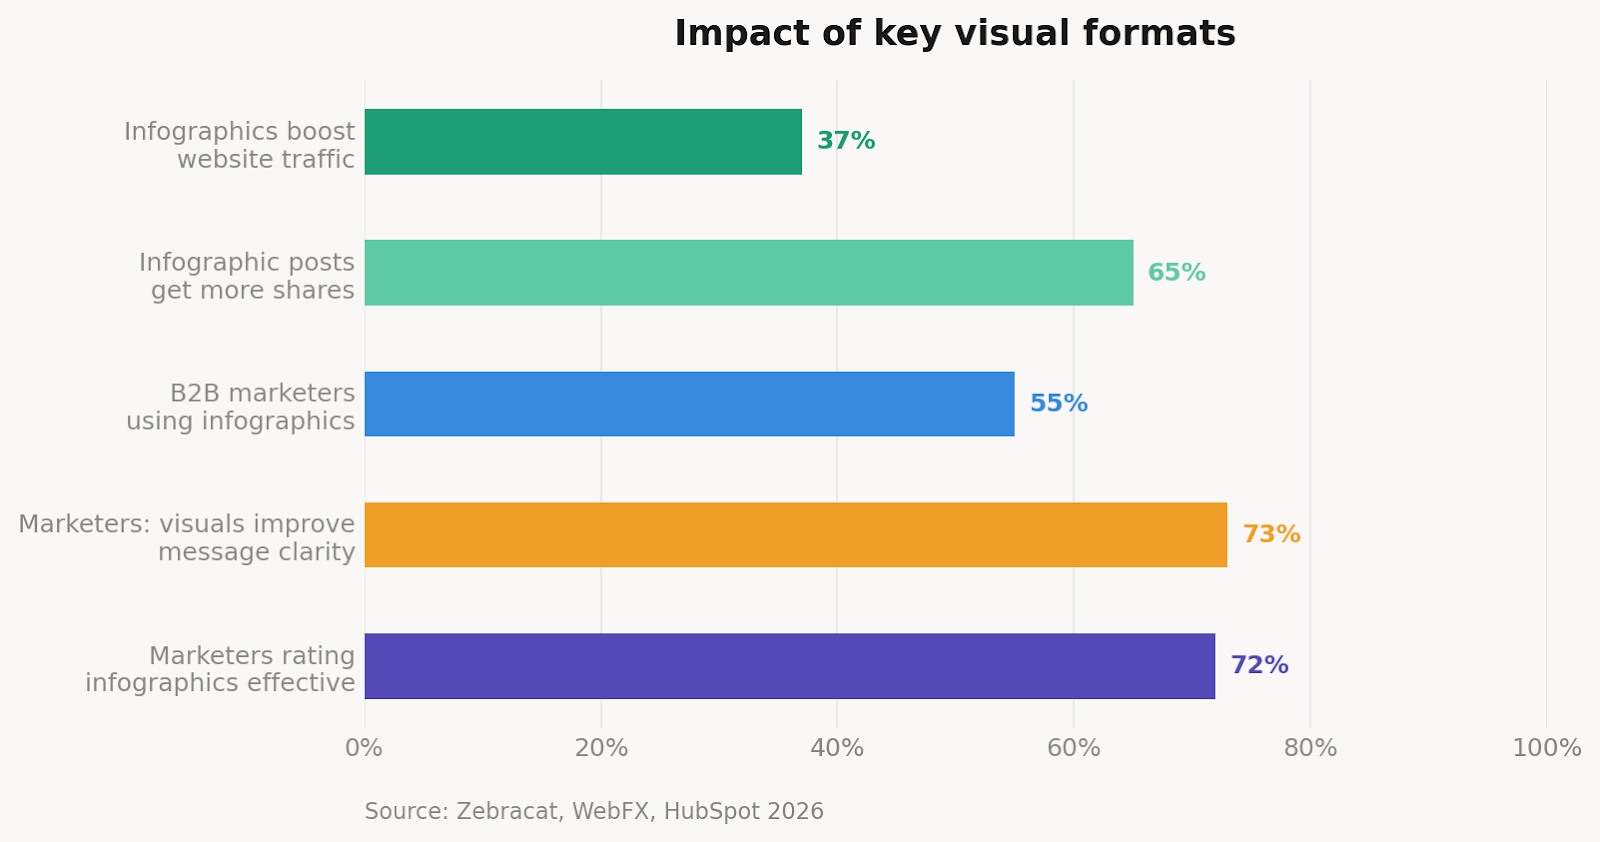
72% of marketers say infographics are among the most effective visual content types for boosting audience understanding. Infographics drive a 37% increase in website traffic on average, and posts that include them receive 65% more social shares.
There are a few distinct styles worth noting:
It presents survey data, research findings, or industry numbers in a format that makes the information scannable and shareable.
It maps a sequence of steps or decisions.
They are widely used for onboarding, how-to content, and procedural explanation.
It sets two or more options side by side. Useful in competitive positioning, pricing decisions, or helping a buyer understand trade-offs.
It communicates brand history, product roadmaps, or historical context with visual progression.
The key limitation of infographics is production effort.
They take longer to produce than a standard image and require design skills to execute well. When done poorly, they create confusion rather than clarity.
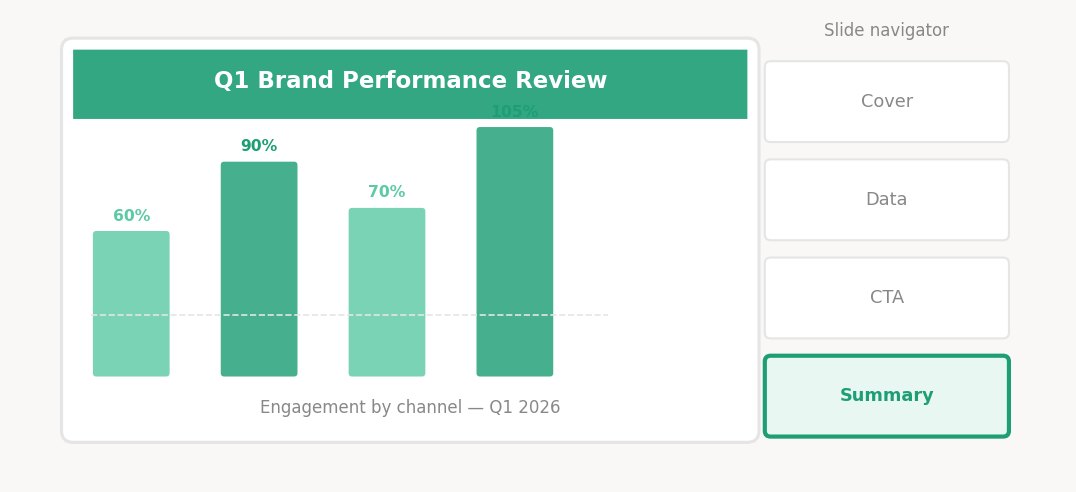
Data visualization is a subset of infographics, but it deserves separate treatment because it functions differently.
Where infographics often blend text and illustration, data visualizations let the data itself carry the meaning.
Charts and data visualization were identified as the most used type of visual content by over 50% of marketers surveyed in one study.
A chart can improve understanding by up to 80% in B2B content contexts.
For brands that work with analytics, research, or any form of quantitative reporting, data visualization is not optional.
Raw numbers without visual structure are routinely ignored. The same data presented as a clear bar chart or line graph is read, understood, and shared.
This format also has specific value for press releases and media content.
When a company announces performance data, product metrics, or market research, a well-built visualization increases the likelihood that journalists and media outlets actually report on it.

Use press releases to get your brand mentioned and recommended by ChatGPT, Gemini, and Perplexity when people search.
 PR playbook to get your brand cited in AI answersHow to check and fix what AI says about your brand2 minutes checklist to make your PR AI-friendly
Where would you like to receive the AI PR toolkit:
Branded graphics include any custom visual that carries a brand’s visual identity without being a photo or a video.
This covers illustrated icons, quote cards, social media templates, branded banners, and presentation assets.
The role of branded graphics is consistency.
A brand with a clear visual identity — defined colors, typography, icon style — can apply that identity across dozens of touchpoints. This repetition builds recognition over time.
Custom illustrations generate approximately 50% higher engagement compared to stock images on social media.
The gap exists because custom graphics look different from everything else in a feed. They carry a signature that stock images cannot.
For brands that are building long-term visibility, branded graphics are the visual system that ties all other content together.
Memes are the highest-shareability format in visual marketing and simultaneously one of the riskiest.
They spread because they are culturally relevant, instantly recognizable, and require almost no effort to consume.

The value of memes is reach.
When a meme lands correctly, it circulates far beyond an organic audience. For brands with strong audience insight, meme content can generate engagement volumes that paid distribution cannot match.
The risk is execution.
A meme that misreads cultural tone, arrives too late to a trend, or misaligns with brand voice causes more damage than benefit.
Meme marketing works best for brands with a defined personality, a clear sense of their audience, and a team that understands timing.
Memes are not appropriate for every brand or every topic. But for the brands that use them well, they are one of the most cost-efficient tools in visual content.
Presentations are underused outside of internal meetings and pitch contexts.
They are a legitimate distribution format. Published on platforms like SlideShare or embedded on a website, a well-structured slide deck reaches an audience that would not engage with a white paper or long-form blog post.
The visual logic of presentations forces clarity. Each slide can carry only so much. That constraint produces cleaner communication than a 3,000-word article might.
Presentations work particularly well for:
Example of presentation slide:
Slides also function as a container for other visual formats. A presentation can include charts, photos, short video clips, and branded graphics, making it a versatile format for complex topics.
Interactive content requires the viewer to do something. This shifts the relationship from passive consumption to active engagement.
62% of marketers want to incorporate more interactive content in their strategy in 2026.
Interactive formats include quizzes, calculators, clickable maps, assessments, polls, and product configurators.
The advantage of interactive content is dwell time and data collection. When a visitor actively participates in a piece of content, they spend longer on the page, generate behavioral data, and are more likely to remember the experience.
The production overhead is higher than most other formats. But for brands that produce interactive content well, the engagement premium is significant.
Visual marketing extends beyond screens.
Packaging, signage, branded merchandise, and print materials all function as visual marketing.
They may be less discussed in digital-focused strategies, but they often produce the most durable impressions.
A consumer who sees a product in a store, holds the packaging, and forms an opinion about the brand is engaging in a visual marketing experience.
Logo design, color choice, and packaging materials all communicate before any written claim is read. For instance:
For consumer product brands, packaging is the most important piece of visual marketing they will ever produce.
For service businesses or B2B companies, physical materials like branded reports, direct mail, or event collateral carry the brand into spaces that digital alone cannot reach.
One format that often sits outside standard visual marketing discussions is the press release.
It is primarily text-based, but it functions within the broader visual marketing system in two important ways.
When a press release is published across established media outlets, it creates brand presence on pages that carry credibility signals.
Those pages are indexed, crawled by AI systems, and referenced by journalists.
The brand’s name and story appear in a visual context — alongside logos, media branding, and editorial design — that influences how that brand is perceived.
Product images, branded graphics, charts, and video links distributed through a press release service extend the reach of visual content to audiences that would not encounter it through social media or direct traffic alone.
MarketersMEDIA Newswire distributes press releases across established media outlets including AP News, Business Insider, Yahoo Finance and USA Today, placing brand announcements in credible media environments where the surrounding visual context supports rather than undermines brand perception.
For brands that already invest in visual marketing, press releases offer a way to distribute that visual story into media ecosystems at scale.
No single format works for every audience or every goal. The choice of visual type should follow from three questions:
If the goal is awareness, short-form video and social graphics move fastest.
If the goal is comprehension, explainer video and infographics work harder.
If the goal is conversion, testimonials and product demonstrations close more effectively than branded imagery alone.
A format optimized for LinkedIn performs differently on TikTok.
Presentation-style content that works on SlideShare fails as a mobile social post. Format selection and distribution channel should be decided together.
Video produces the highest engagement but requires the most resources.
Infographics require design time. Interactive content requires development. Image and text-based graphics can be produced consistently at lower cost.
The right answer is a mix, not a single format commitment.
83% of social media marketers say visual content is the most important type of content for engagement in 2026.
The gap between text-only and visual-led content continues to widen.
The brands that understand the function of each format — and match format to goal — are the ones that close that gap in their favor.
Visual marketing is not a checklist of formats to produce. It is a consistent system of signals that tells audiences, search engines, and AI systems what a brand stands for and how it operates.
Every infographic, product video, and press release placement contributes to that system.
The brands that win attention are not producing more visual content. They are producing clearer, more intentional visual content across the right channels.
If distributing that content across credible media outlets is part of your strategy, MarketersMEDIA Newswire can help place your brand story where audiences and search systems are already looking.
Reach out to our team to learn how press release distribution fits into a broader visual marketing strategy.
A: Visual marketing refers to the broader use of visual content — videos, images, infographics, and branded graphics — to communicate a brand’s message across digital and physical channels. Visual merchandising is specifically about product display in retail spaces, including shelf layout, signage, and in-store aesthetics. The two disciplines overlap in product presentation but serve different contexts.
A: Yes. Visual content contributes to SEO through multiple mechanisms. Video embeds increase page dwell time, which is a positive behavioral signal. Optimized images with descriptive alt text and file naming contribute to image search visibility. Infographics earn backlinks when other sites reference and share them. Pages with strong visual content tend to have lower bounce rates and longer session durations, both of which support ranking performance over time.
A: B2B audiences respond well to data visualizations, infographics, explainer videos, and webinar content. These formats communicate credibility and expertise rather than personality-led engagement. Case study videos and branded presentation decks also perform strongly in B2B sales contexts because they support the longer, more complex decision-making processes typical of B2B buyers.
A: AI systems that generate search answers and brand summaries draw from publicly indexed content. Brands that distribute visual content — and the text surrounding it — across established, authoritative domains are more likely to be understood and referenced accurately by AI. Press releases distributed through credible newswires, blog posts with supporting visuals, and consistent branded content on indexed pages all contribute to how AI systems characterize a brand over time.
A: Branded graphics and UGC tend to offer the best return for brands with limited production budgets. Branded graphics can be produced consistently using template-based design tools and require no photography or video setup. UGC shifts production responsibility to customers and generates trust signals that brand-produced content cannot replicate. As budget scales, short-form video and infographics add meaningful reach and engagement without requiring the full investment of long-form video production.


 PR playbook to get your brand cited in AI answer
How to check and fix what AI says about your brand
2 minutes checklist to make your PR AI-friendly
PR playbook to get your brand cited in AI answer
How to check and fix what AI says about your brand
2 minutes checklist to make your PR AI-friendly