New Media Unlocked!
You can now publish on USA TODAY through MarketersMEDIA. That's 142M+ monthly visitors and DR 92 backlinks for every release you publish.
Better reach, better SEO, better credibility.
You can now publish on USA TODAY through MarketersMEDIA. That's 142M+ monthly visitors and DR 92 backlinks for every release you publish.
Better reach, better SEO, better credibility.
There’s a difference between sending out a press release and knowing if it actually did anything.
It might have been picked up. It might have been seen. But did it lead to the outcome you wanted?
By measuring the impact of a press release, PR pros can obtain an accurate picture of whether or not it achieved its goals.
It’s the only way to know if your message landed, if your audience engaged, and if it moved the needle on traffic, leads, or brand visibility.
In this post, we’ll walk through how to actually measure what matters when it comes to your press releases—so you can spot what’s working, fix what’s not, and maybe even convince your boss it was worth the budget.
Free Press Release Template
Get your free copy of press release template and advanced PR guide to run your press release.

Measuring a press release begins with setting clear objectives.
Are you trying to increase website traffic? Announce a partnership to gain media coverage? Drive interest in a product launch?
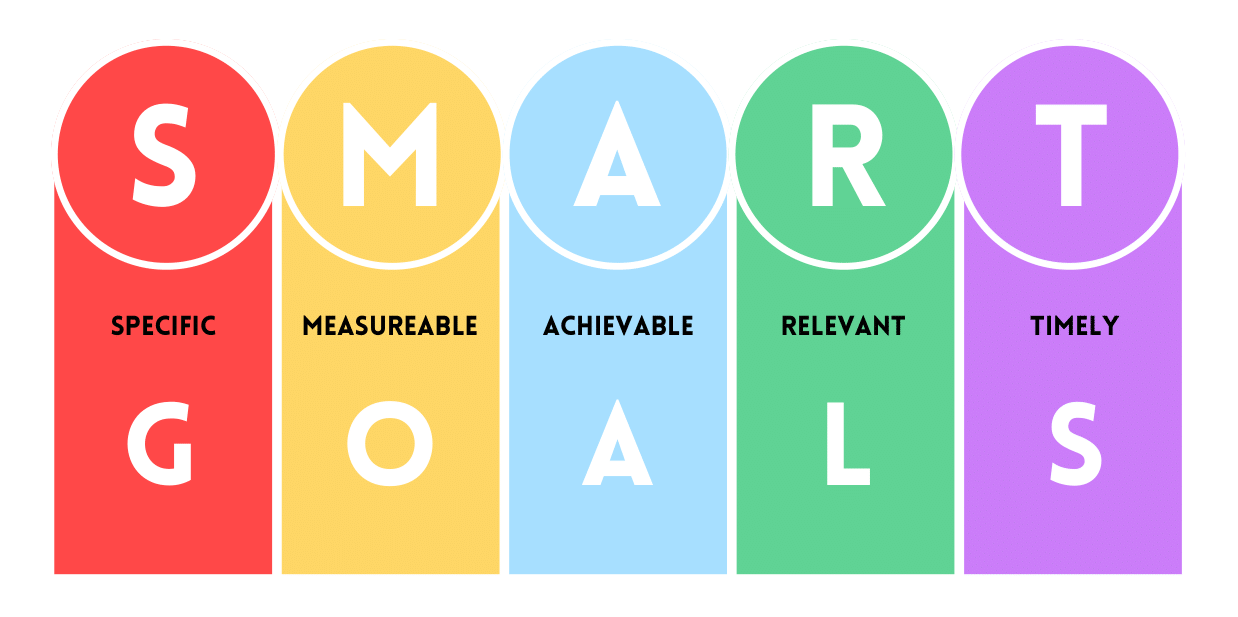
This is where SMART goals help:
Here’s what a SMART goal might look like in a press release campaign:
Setting goals like this doesn’t just make reporting easier—it gives you something real to aim for. And once your release goes out, you’ll know exactly what success looks like.
Once your release goes live, it’s time to measure how it actually performed.
Some results can be seen right in your distribution report—like which outlets picked it up. Others require digging into analytics tools to understand visibility, engagement, or sentiment.
Here’s how to break it down.
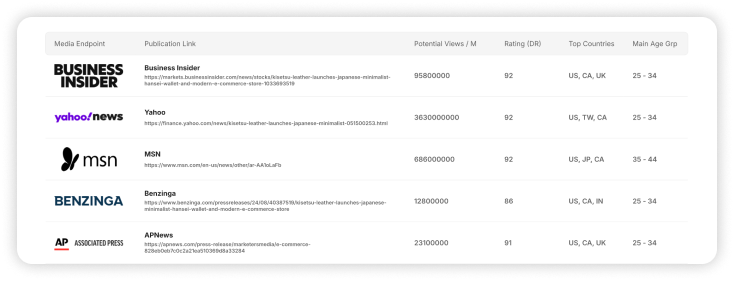
One of the most immediate things you can track after publishing a press release is media coverage.
Most distribution platforms, including MarketersMEDIA Newswire, provide a detailed report showing where your release appeared and which outlets picked it up.
This gives you a clear record of:
But the raw numbers only tell part of the story. Ask yourself:
One strong mention in a trusted, high-traffic publication can do more for your reputation and reach than dozens of minor ones.
Reviewing this part of your report helps you understand how your release landed in the media—and whether it reached the types of outlets your audience actually trusts.
Once you’ve reviewed your media coverage, the next step is to assess how far your release may have traveled—and through which channels.
This is where visibility metrics come in.
While your distribution report may estimate potential reach based on the audiences of the media outlets, you’ll likely need to rely on additional tools to get more detailed insights.
Here’s what to track:
Visibility alone doesn’t tell you much about impact, but it helps you confirm your release was delivered and seen. From here, you can dig into how people engaged with it—and what came next.
After you’ve seen where your release landed, it’s time to find out how people interacted with it.
Engagement metrics help you understand how well your content held attention—and whether it encouraged people to take the next step.
What to track:
If your engagement is low, it might be a sign that the topic didn’t land—or that your headline or call to action could use work.
Traffic and conversion data helps you see how your press release contributed to business goals.
You’ll need tools like Google Analytics or your CRM to track:
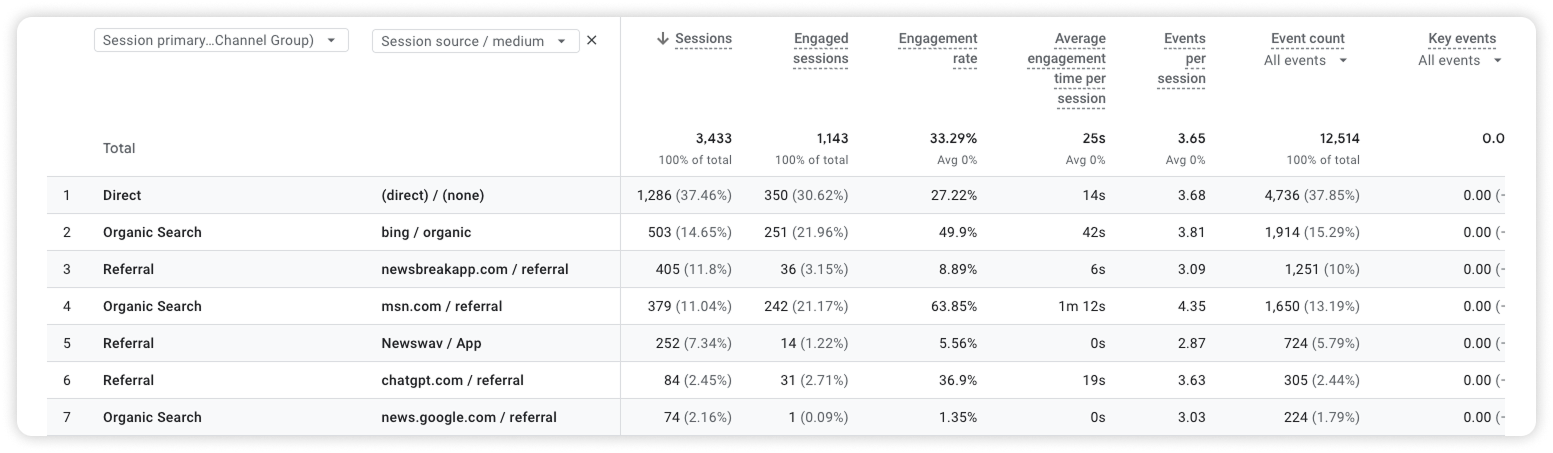
This is often the clearest proof of whether your press release actually drove results, not just visibility.
Not everything can be measured in clicks. Sometimes, the reaction around your release is just as valuable.
Look at:
A few strong reactions can be more meaningful than a hundred neutral views—especially if they come from people in your target audience.
Finally, circle back to your original goal. Did the release achieve what you set out to do?
If not, or even if it did, the next step is interpreting what the data actually tells you—so you can use those insights to improve your next release.
Once you’ve collected the numbers, go back to the goal you set at the beginning.
Was the outcome aligned with what you wanted to achieve?
If your target was 300 visits to a landing page and you got 190, that’s still useful—now you know what’s realistic or where the drop-off happened. If your aim was media coverage in specific outlets but it landed elsewhere, that might inform how you pitch next time.
Don’t just ask “did it work?” Ask:
Reviewing your results against your original goal helps you move from guessing to improving with purpose.
Every press release gives you new information.
Over time, those insights help you spot patterns—like which headlines get picked up, which media contacts tend to respond, or which channels drive traffic.
Use that data to:
You don’t need to overhaul your entire strategy every time. Even small changes, made consistently, lead to better results over time.
Measuring the effectiveness of a press release isn’t complicated—but it does require you to look beyond surface numbers.
Impressions and pickups tell you where your story went. Engagement, traffic, and conversions show you what it did. And tying it all back to a clear goal is what makes it meaningful.
Each release is an opportunity to learn. Use what the data tells you, adjust your strategy, and keep refining. That’s how good PR turns into better results—consistently.
If you want your next press release to come with built-in reporting that shows exactly where your news appeared, MarketersMEDIA makes it easy to get started.
Publish your release, track real coverage, and build on what works.


 PR playbook to get your brand cited in AI answer
How to check and fix what AI says about your brand
2 minutes checklist to make your PR AI-friendly
PR playbook to get your brand cited in AI answer
How to check and fix what AI says about your brand
2 minutes checklist to make your PR AI-friendly