New Media Unlocked!
You can now publish on USA TODAY through MarketersMEDIA. That's 142M+ monthly visitors and DR 92 backlinks for every release you publish.
Better reach, better SEO, better credibility.
You can now publish on USA TODAY through MarketersMEDIA. That's 142M+ monthly visitors and DR 92 backlinks for every release you publish.
Better reach, better SEO, better credibility.
Table of Content


Marketing teams collect data constantly. Website visits, social followers, email opens, ad clicks. The numbers pile up in dashboards and reports.
But most of this data tells you nothing about business success.
The problem isn’t the quantity of data. It’s the quality of measurement. Too often, teams measure what looks good on paper but fails to tie back to growth, revenue, or strategy.
This guide breaks down which marketing KPIs actually matter, how to pick the right ones for your goals, and the traps that waste time and budget.
Free Press Release Template
Get your free copy of press release template and advanced PR guide to run your press release.

A Key Performance Indicator (KPI) measures progress toward a specific business objective. Not every data point in your analytics platform qualifies.
The relationship flows like this: Goals define what you want to accomplish. KPIs measure progress toward those goals. Metrics provide the underlying data that feeds into KPIs.
Most marketing teams make three fundamental mistakes:
Clarity about the outcome you want is always step one.
Effective KPI selection follows a simple hierarchy. Start with business objectives, then identify the key activities that drive those outcomes.
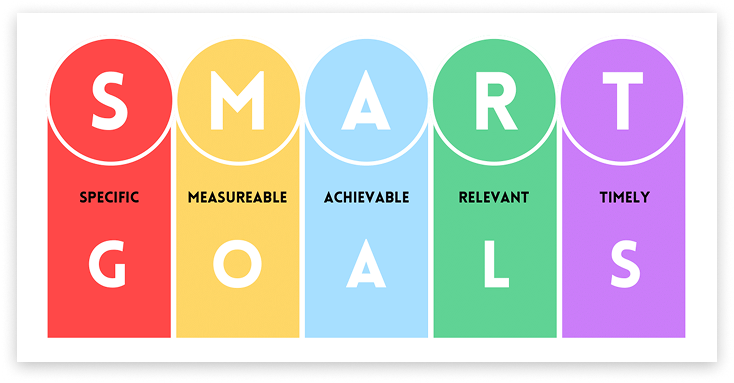
Every marketing KPI should meet five criteria:
“Increase brand awareness” fails this test. “Increase branded search volume by 30% in Q1” passes.
Not all companies measure success the same way.
B2B Marketing KPIs focus on relationship-building and longer sales cycles:
B2C Marketing KPIs emphasize transaction volume and customer behavior:
B2B deals take time and multiple approvals. B2C decisions happen faster, often in one session. Your KPIs should reflect that difference.
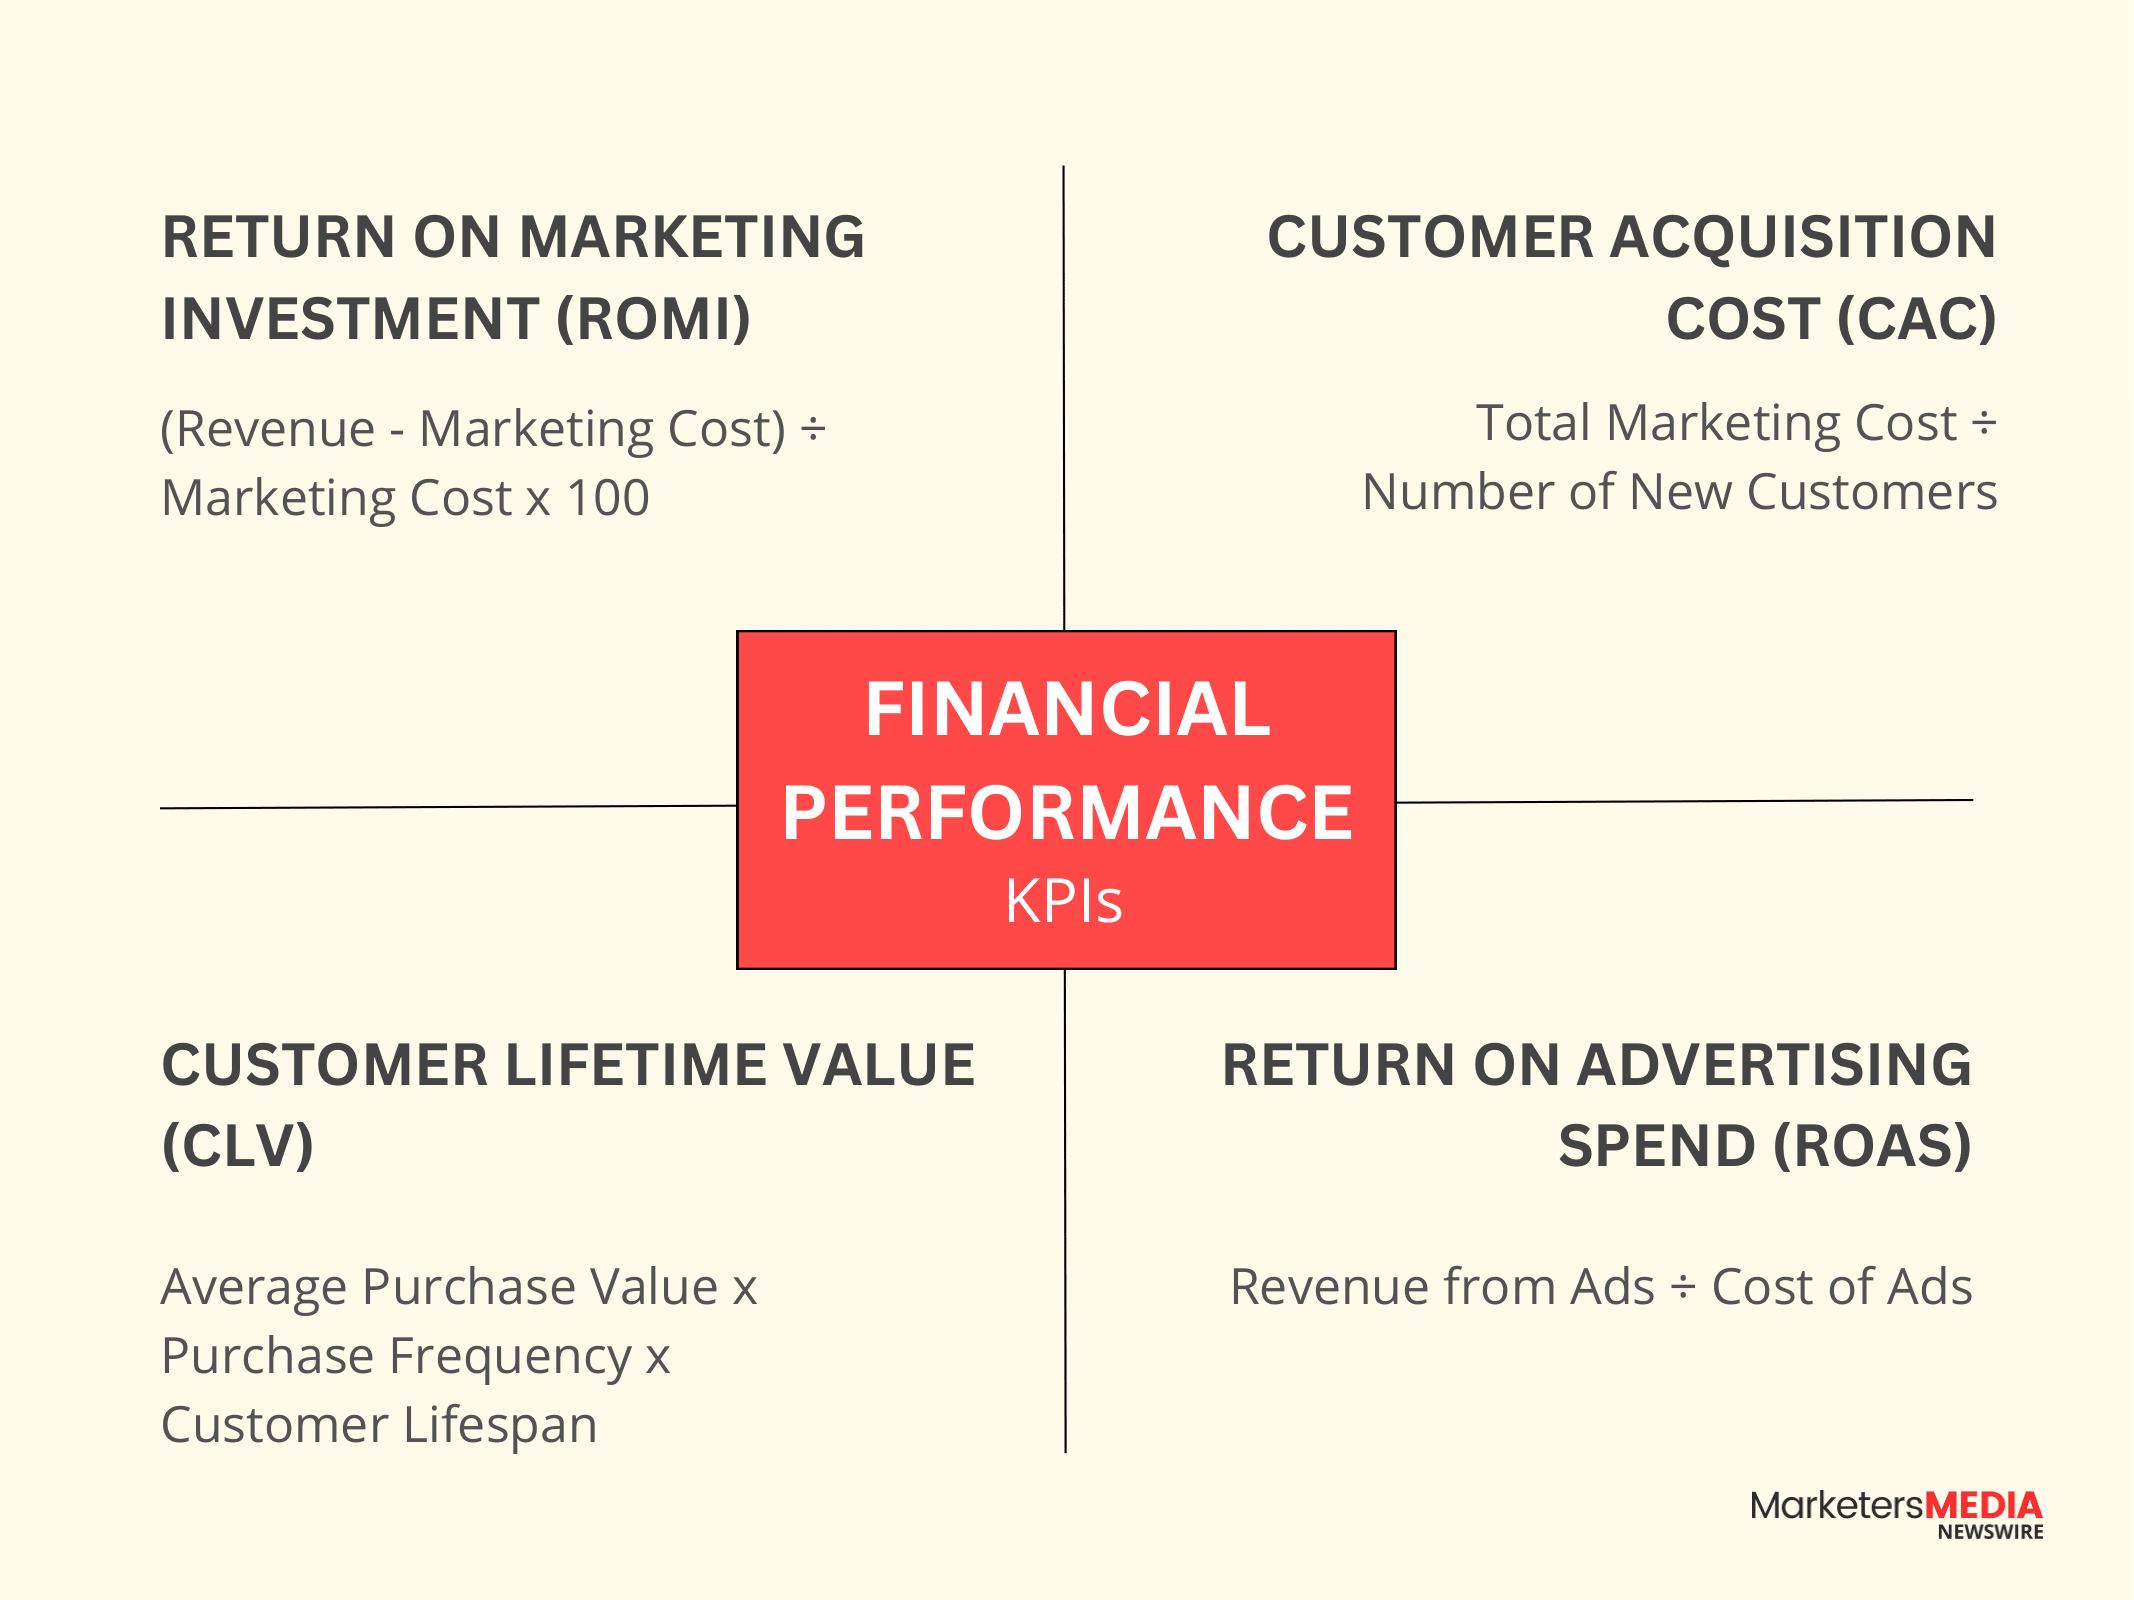
These metrics directly connect marketing activities to revenue impact.
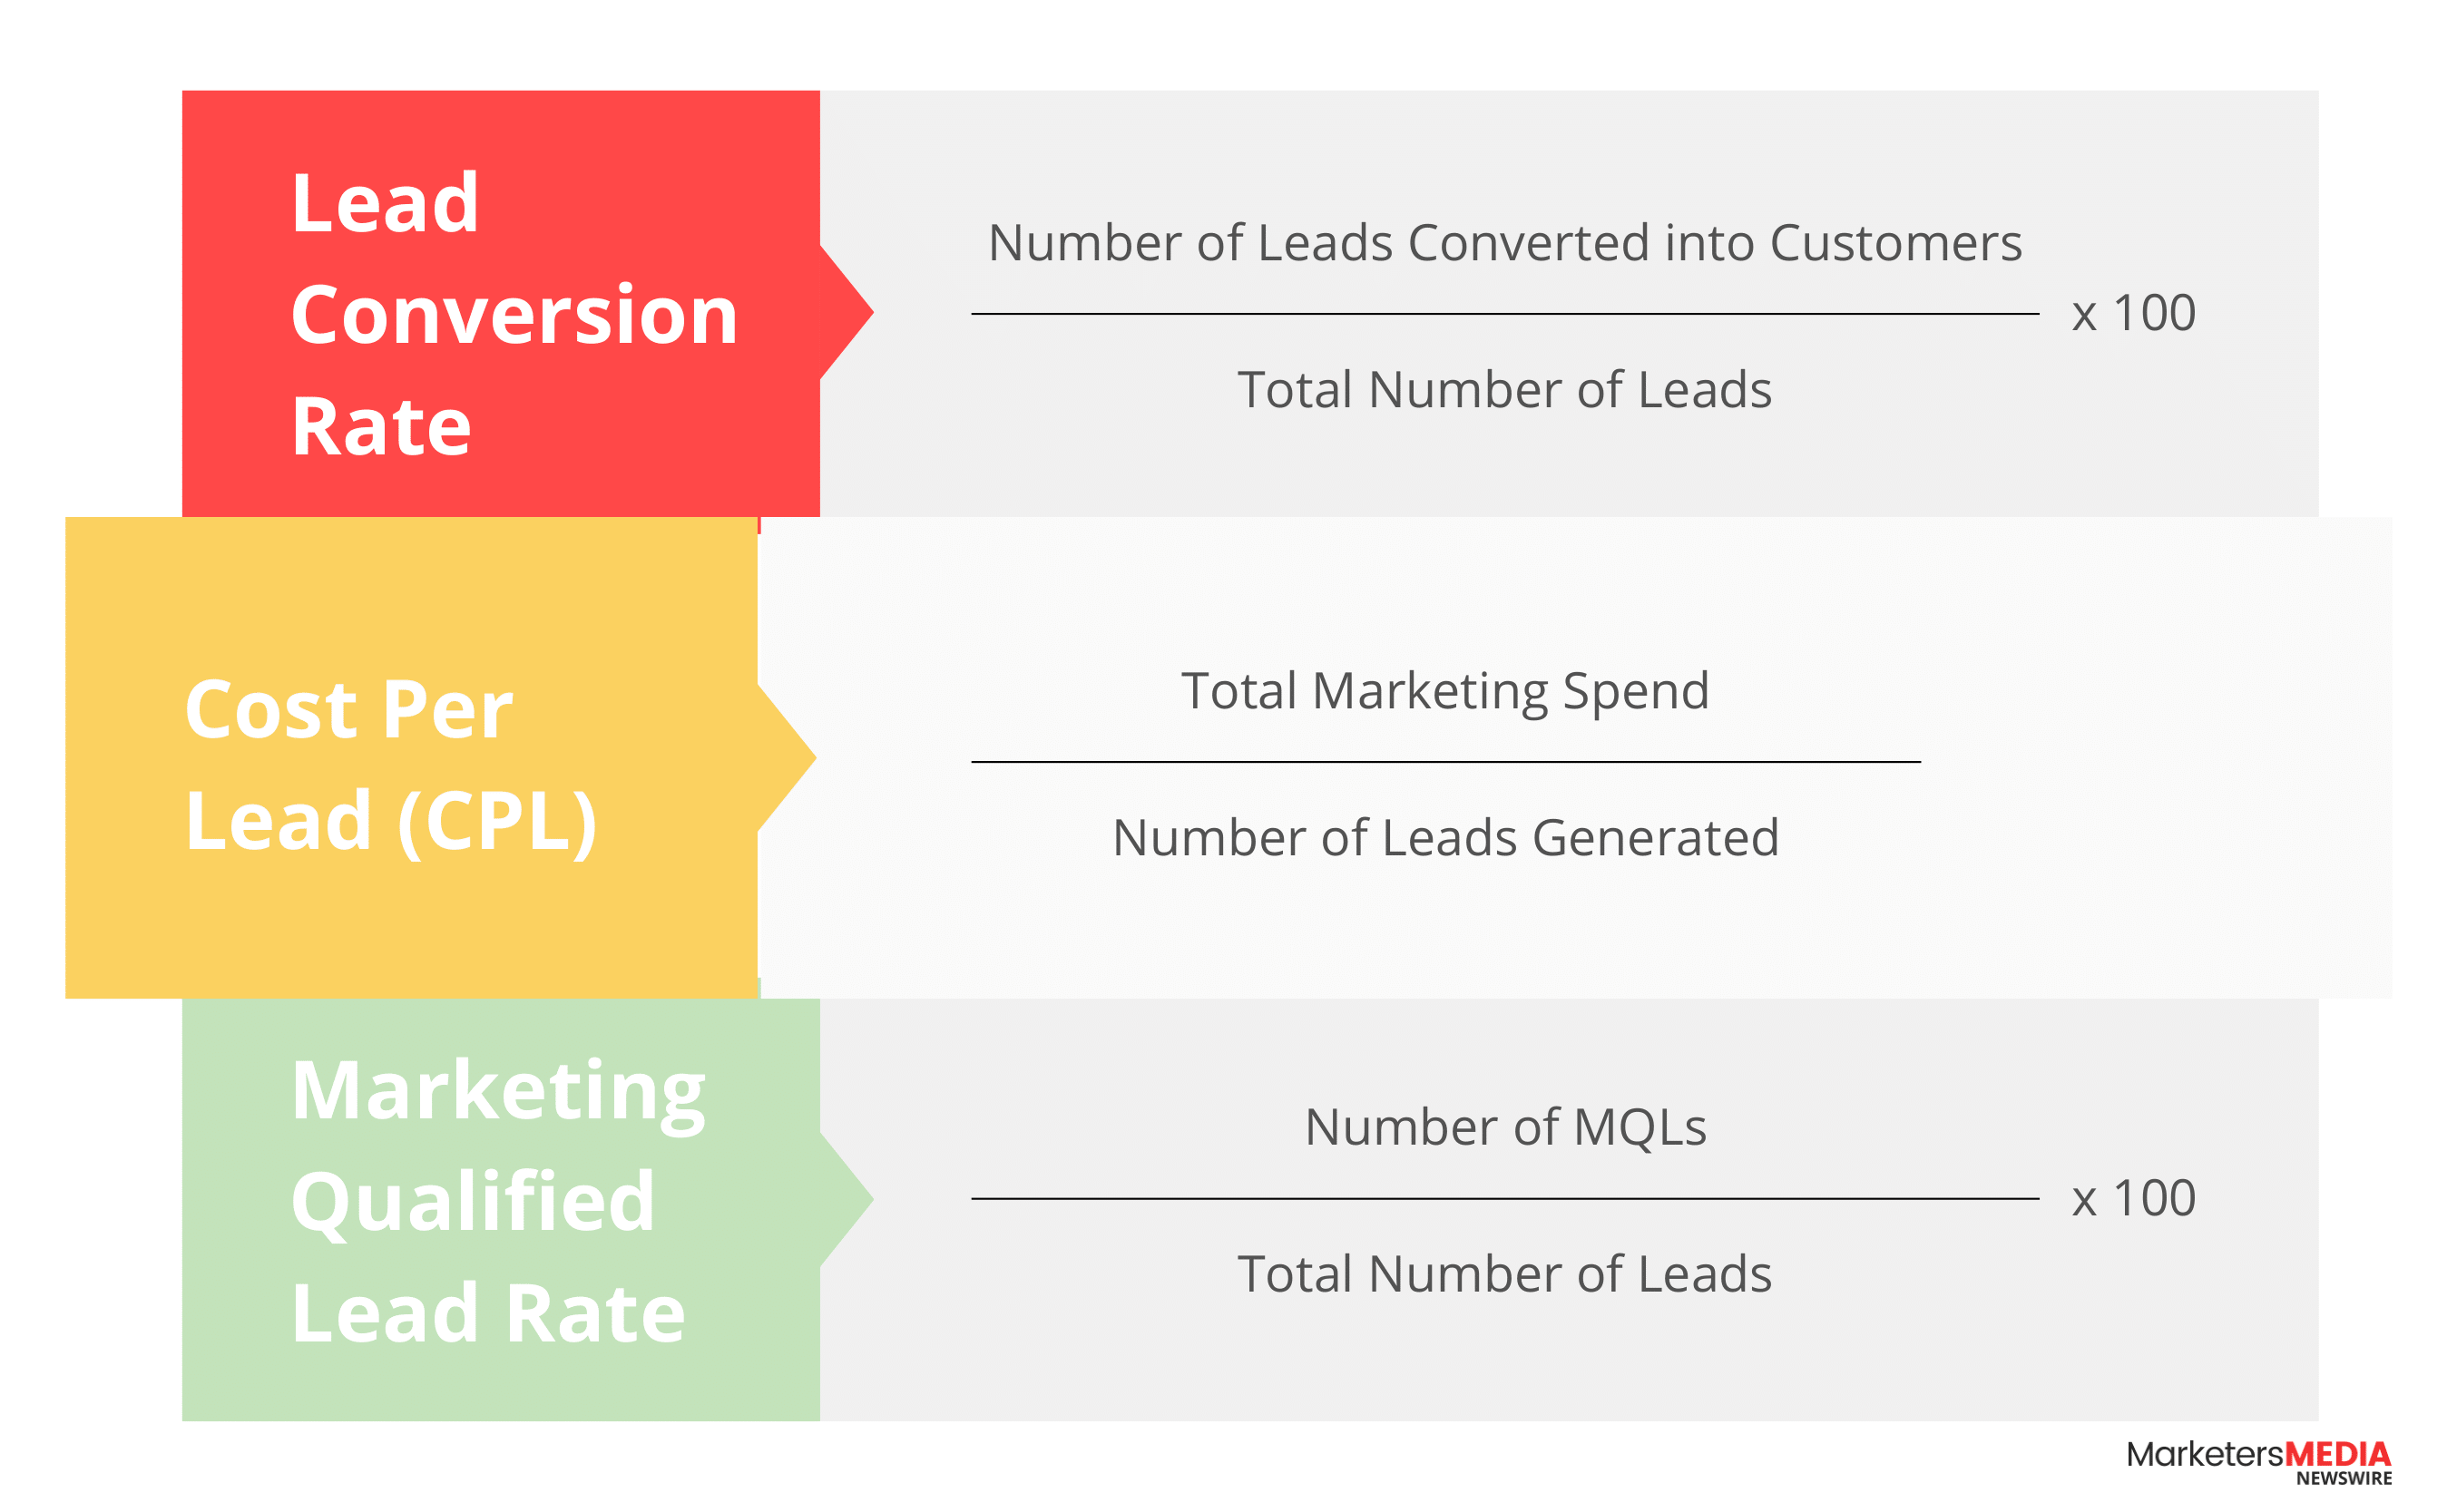
These show how efficiently marketing turns interest into revenue.
These reflect how digital channels perform.
These metrics indicate content quality and user experience effectiveness.
Email remains one of the most measurable channels.
Acquiring new customers can cost five to twenty-five times more than keeping existing ones. Retention KPIs show how well you maintain relationships and protect recurring revenue.
Don’t begin with available data. Start with what your business needs to achieve, then work backward to identify the metrics that best indicate progress.
For every potential KPI, run it through these questions:
Track fewer metrics more deeply rather than many metrics superficially. Most successful companies focus on 3-5 primary KPIs per department.
Assign clear ownership for each KPI. Define what success looks like and what actions you’ll take when metrics move in either direction.
Markets move. Customer behavior evolves. Strategy changes. Revisit your KPIs at least quarterly to confirm they still align with priorities.
The measurement environment is only getting tougher. Privacy rules, shifting consumer habits, and more channels make attribution harder every year.
The edge won’t come from tracking more. It will come from tracking the right metrics with precision and acting on them with speed.
Start by auditing your current KPI set:
Cut the metrics that don’t matter. Double down on the ones that drive real business impact.
Your goal isn’t perfect measurement. It’s strategic clarity that enables faster, better business decisions.
The companies that win in the next decade will be those that turn data overwhelm into strategic focus – measuring less, but measuring what matters.
A: B2B KPIs focus on relationship-building and lead qualification (e.g., MQLs) due to a long sales cycle. B2C KPIs emphasize transaction volume and customer behavior (e.g., Average Order Value) due to a shorter, emotion-driven sales process.
A: Attribution is the process of assigning conversion credit to each customer touchpoint (e.g., ad, blog, email). It’s essential for MROI (Return on Marketing Investment) because it ensures your calculation is accurate by correctly measuring the return generated by specific marketing efforts.
A: The most significant error is failing to link KPIs directly to the overarching business strategy. If a KPI isn’t tied to what the business is trying to achieve, it becomes irrelevant data that wastes time and resources.
A: Intent Data captures behavioral signals to show if a prospect is “in-market” and actively ready to buy. It helps B2B marketers prioritize accounts that are closest to a decision, improving lead quality and sales efficiency.
A: SMART ensures a KPI is Specific, Measurable, Attainable, Relevant, and Time-Bound. This structure is required to make the KPI actionable, quantifiable, and directly linked to a business outcome.


 PR playbook to get your brand cited in AI answer
How to check and fix what AI says about your brand
2 minutes checklist to make your PR AI-friendly
PR playbook to get your brand cited in AI answer
How to check and fix what AI says about your brand
2 minutes checklist to make your PR AI-friendly